
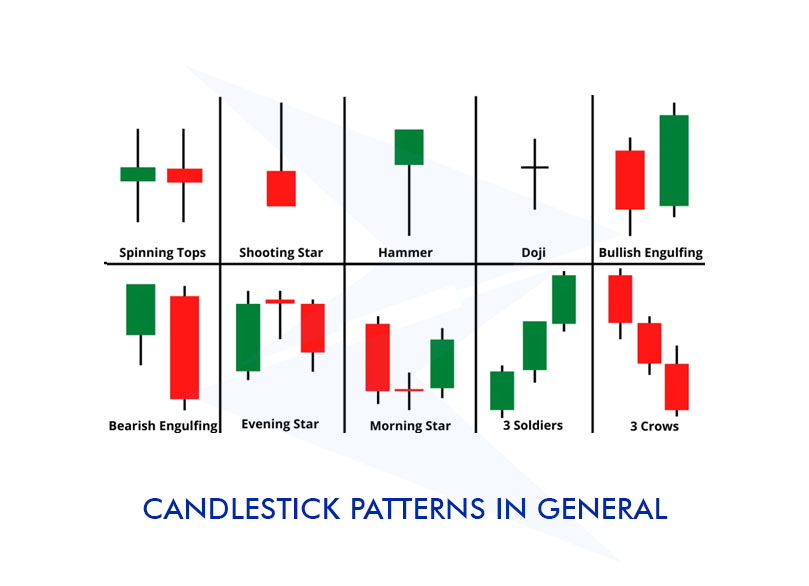
Step 1: What is a Candlestick Chart
A single candlestick includes four prices: opening price, closing price, highest price, and lowest price. Green indicates an upward trend, while red indicates a downward trend.
Step 2: 1-Minute Candlestick Chart
Click the time period at the top and select [1m] for the 1-minute candlestick chart. Each candlestick represents the price movement within one minute, which is suitable for short-term trading reference.
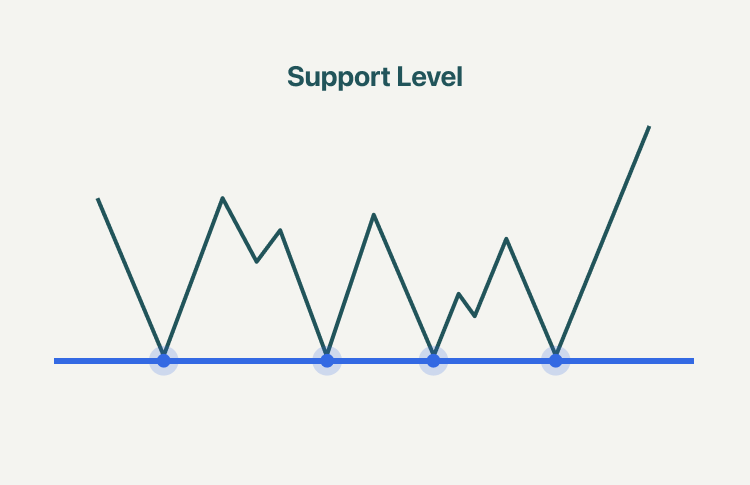
Step 3: What is a Support Level
A support level refers to a price level where the price rebounds repeatedly after dropping to it — it holds up the price like a floor.
Step 4: What is a Resistance Level
A resistance level refers to a price level where the price pulls back repeatedly after rising to it — it suppresses the price like a ceiling.
